DataBridge · the low-code studio

Build the app.
Skip the developers.

DataBridge is the studio built into Front Door: a drag‑and‑drop designer with 50+ components, code‑free SQL data binding, a formula engine and automation. Your ops and finance teams ship dashboards, forms and data apps in hours — not sprints.
DataBridge · KPI Card Designer
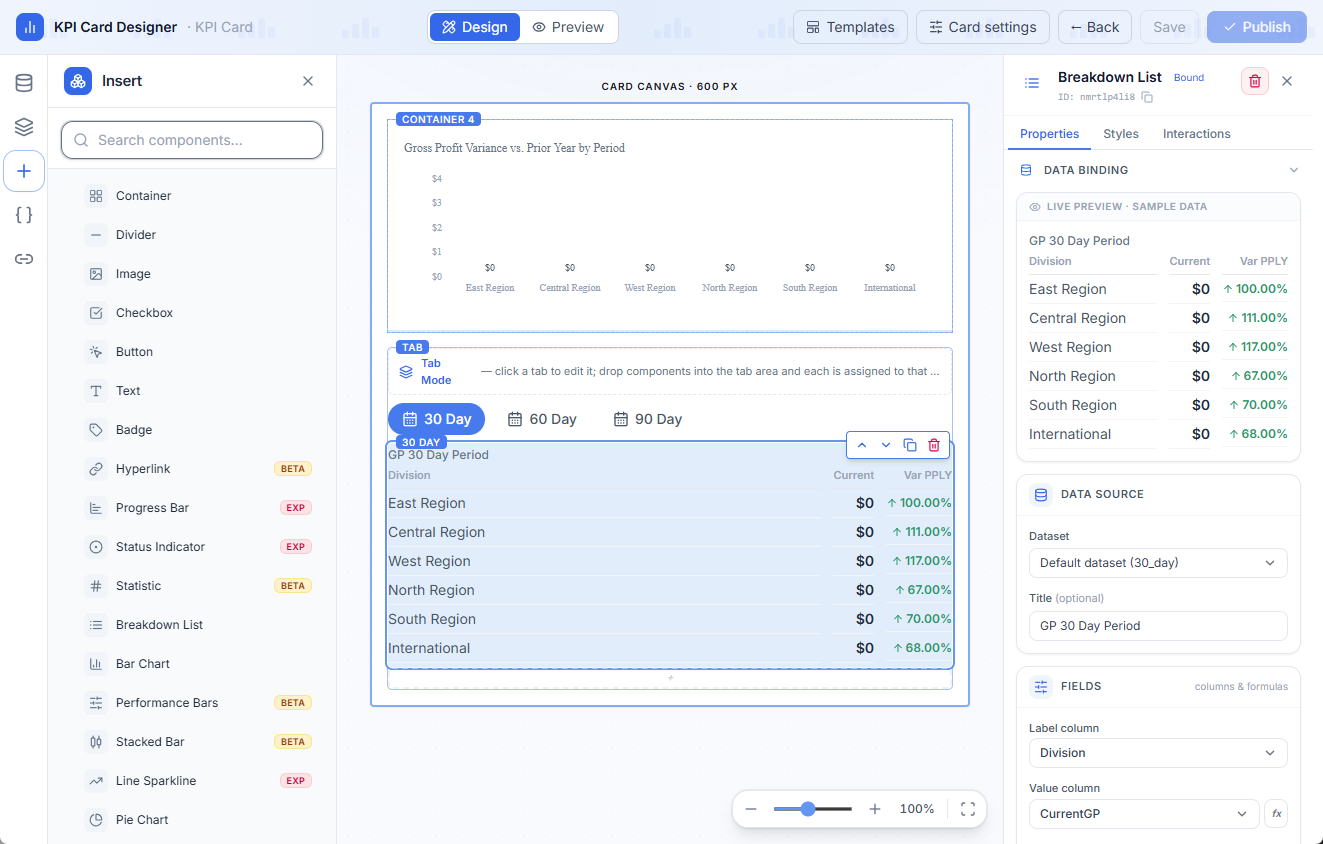
DataBridge KPI Card Designer — a drag-and-drop component palette, a data-bound breakdown list on the canvas, and a live properties panel with sample data
50+ built-in components

Everything a data app needs, ready to drag onto the canvas.

TablePivot Table (OLAP)Process TableChartPie · Donut · GaugeStacked BarsLine SparklineKPI CardKPI AdvancedStatisticBreakdown ListGallery ProCalendarDetails ViewData Entry GridForm inputsSelect · Date · RatingRich TextFile UploadSearchBannerEmbed PowerAppHTML iframeDocument ImportExcel Export
Design → bind → publish

A real designer, not a form wizard.

Drag components onto a canvas with a tree outline and a properties panel. Bind them to your SQL Server or Azure SQL with raw T‑SQL over permission‑trimmed connections — server‑side paging and scheduled sync handle tables up to a million rows.

Undo/redo & live preview — every edit is reversible; the canvas shows real data as you build.
Formula & variable engine — standard, calculated, SQL and system variables with an expression builder.
Automation & events — per‑component triggers and actions, conditional formatting, result rules.
Theme Studio & Pivot — premium table/pivot styling and full OLAP pivots with drill‑through.

SQL data binding

Raw T‑SQL, permission‑trimmed, server‑side paging and sync.

Formulas & variables

Expression engine with a function reference, resolved securely.

Automation & events

Triggers → actions, visibility, filtering, result rules.

Theme Studio

Header, subtotal & grand‑total colors, banding, palettes.

See the studio in action

Real screens from the DataBridge studio.

DataBridge · Data Capture
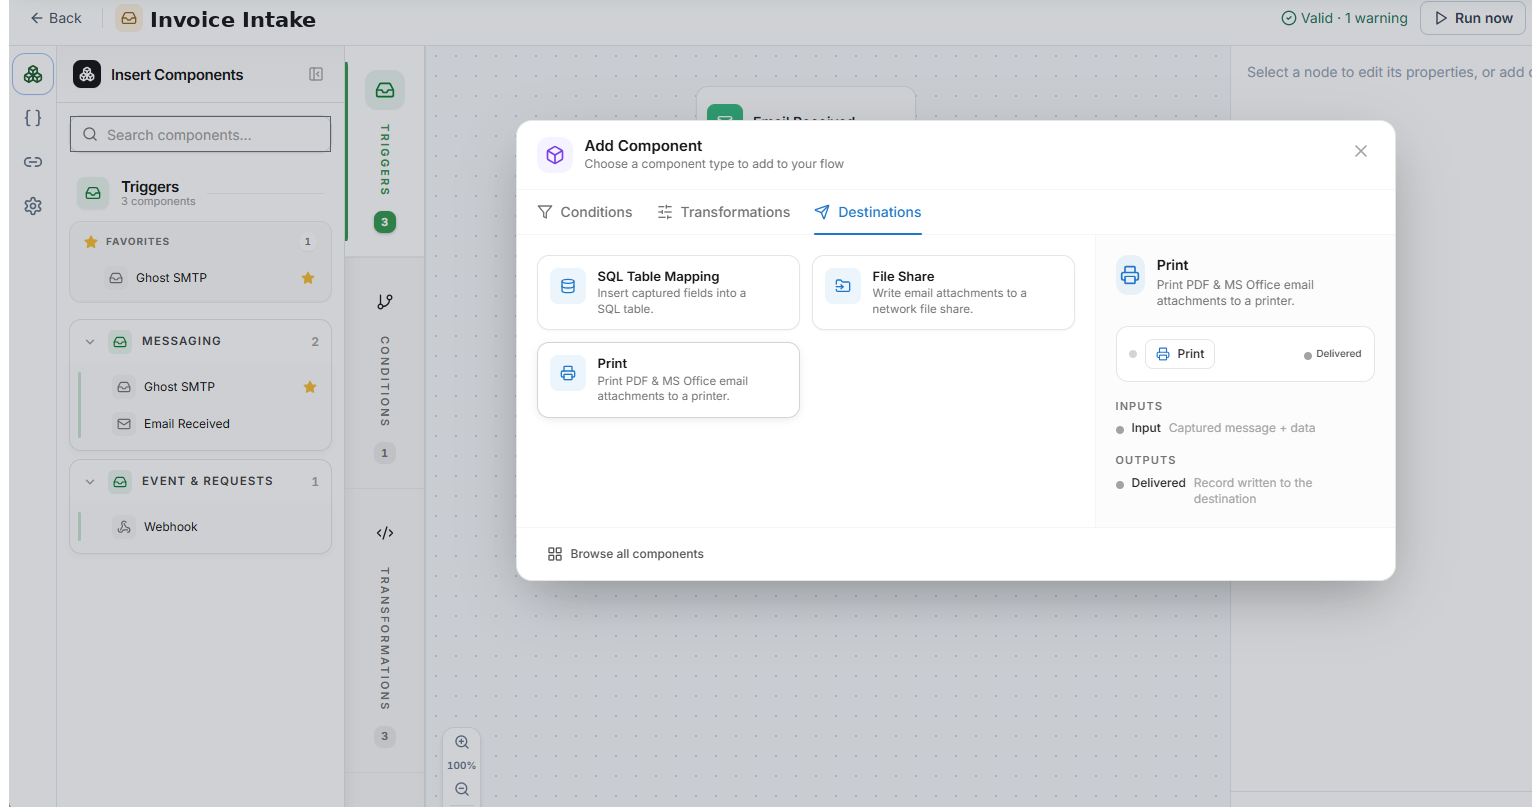
Data Capture flow designer — a component palette of triggers, conditions, transformations and destinations for routing inbound data to SQL, a file share or print
Data Capture

Turn inbound email into records — no code.

Build a capture flow visually: start from an email or webhook trigger, add conditions and transformations, then route the result to a SQL table, a network file share or a printer. Drag components from the palette, and every node validates before you run it.

Document Import

A PDF in. Structured rows out.

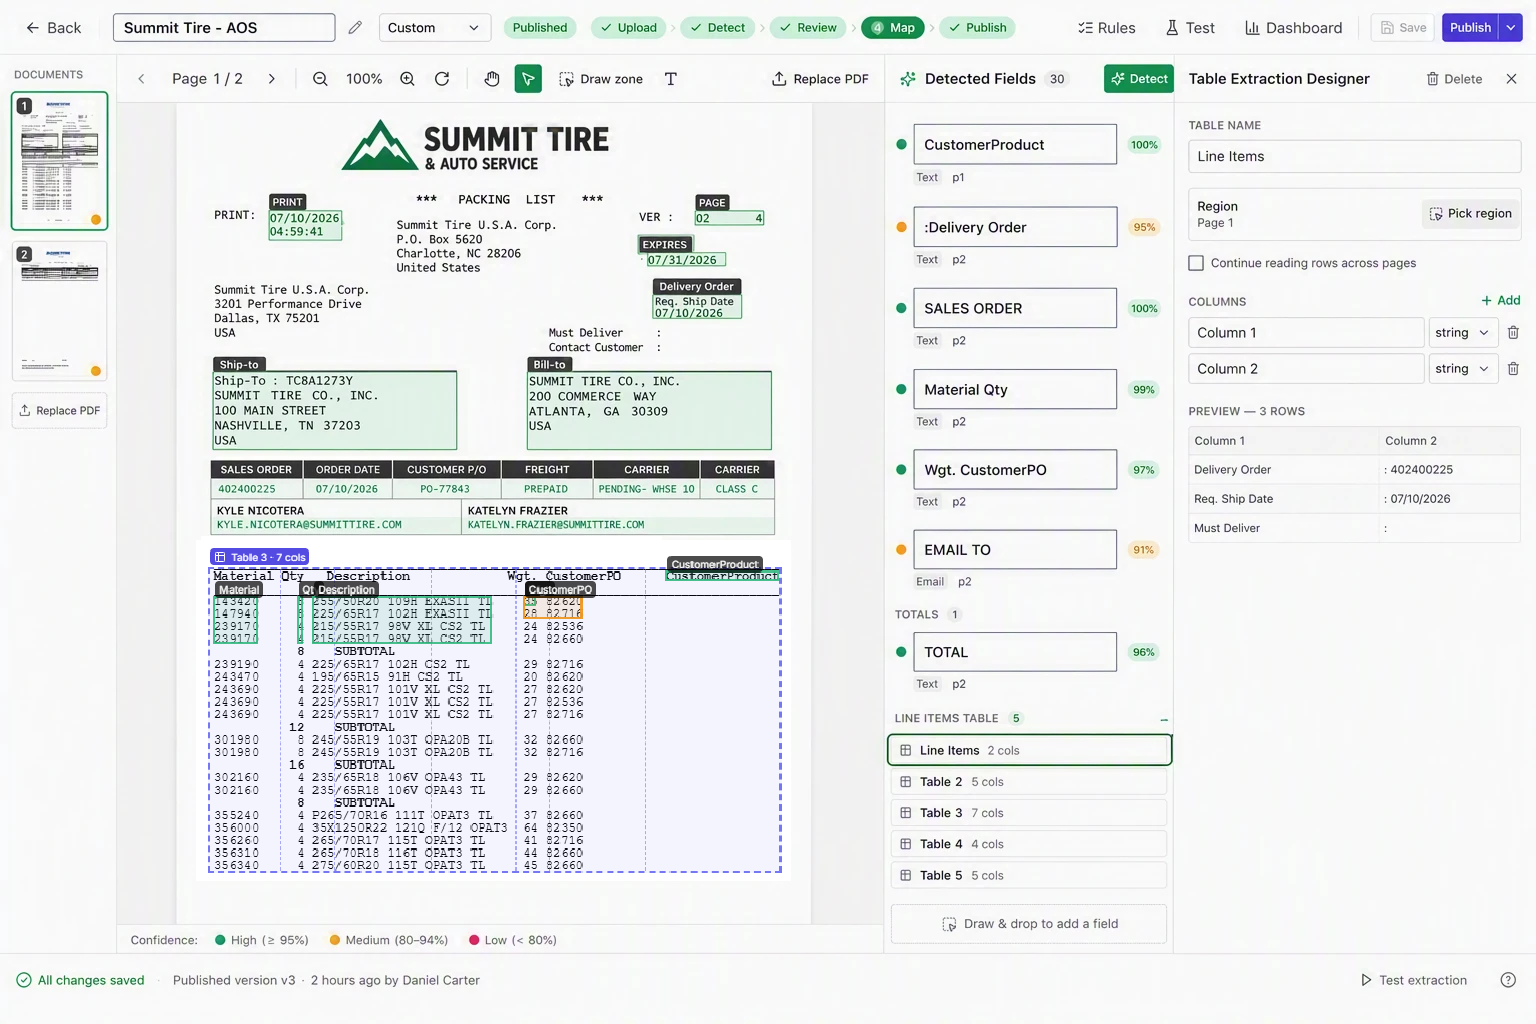
Upload an invoice or packing list and DataBridge reads it against a template with Azure Document Intelligence — detecting fields with confidence scores and mapping line‑item tables straight into SQL columns. Draw a zone to capture anything the model missed, review, and publish.

DataBridge · Document Import
Document Import table extraction designer — detected fields with confidence scores mapped from a PDF invoice into SQL columns
Beyond dashboards

Turn documents and inbound data into records — automatically.

Document Data Import

Upload a PDF; it's read against a template with Azure Document Intelligence and written to SQL as a header plus line‑item tables — in one transaction, with review.

Data Capture flows

A visual flow designer for inbound data — email and webhook triggers, document extraction and branching — routed to SQL, a file share or print.

Scheduled Subscriptions

Deliver any report or page as a pixel‑perfect PDF or a formatted Excel workbook to recipient groups on the cadence you set.

Watch a data app get built in minutes.

We'll build a live dashboard from one of your tables on the call.